+ Product & sound optimization
+ System analysis
+ Market & competition analysis
+ Quality monitoring
+ Simulation & virtual vehicle
+ In-vehicle speech applications
+ Standards-compliant testing
+ Voice quality
+ Audio quality
+ Speech recognition
+ Speech intelligibility & listening effort


Solution- and resource-oriented
Benefit from innovative, scientifically-based methods and our three decades of experience and expertise. We work with you to identify project goals and successfully implement the resulting requirements. Whether as an independent partner or in collaboration with your team, we will find the right solution.
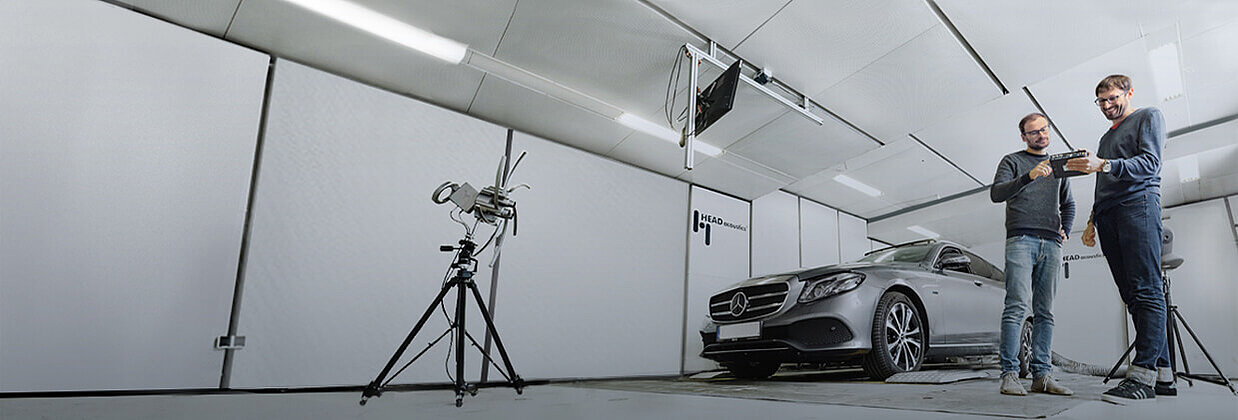
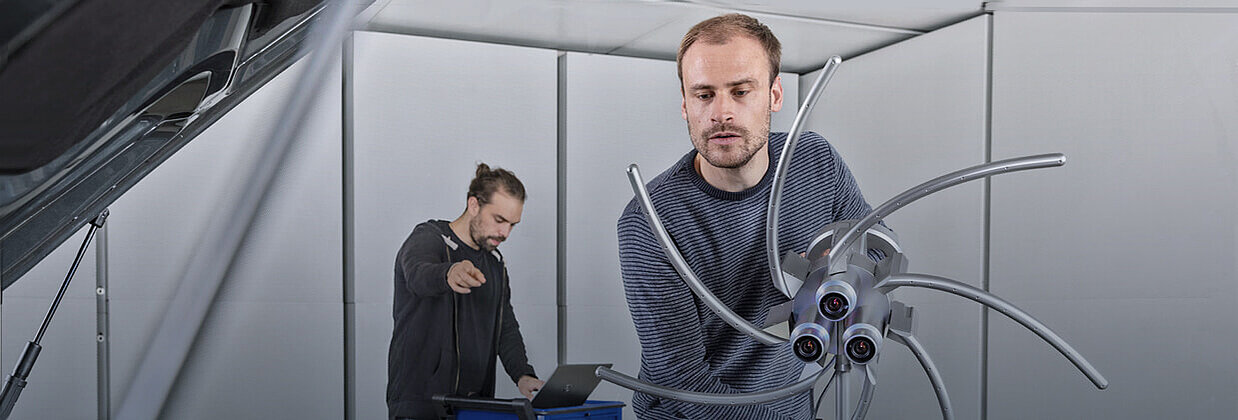
Our expert knowledge and state-of-the-art tools form the foundations for vibroacoustic product optimization. Our analyses and customized solutions are based on a combination of experimental and numerical methods, and more.
Our scope of services includes:
- Analyzing sound problems using methods such as Transfer Path Analysis (TPA) and machine learning
- Target sound definition using Jury Testing and unique methods such as HEAR! (HEAD Empirical Assessment Ride)
- Active Noise Engineering (ANE), for instance by developing acoustic masking technologies
A clearly defined, structured approach and the use of suitable measurement and analysis tools enable us to analyze and interpret the complex underlying physical correlations in the generation of sound and vibration.
To optimize the vibroacoustic behavior of systems, we employ a range of different methods:
- (Binaural) Transfer Path Analyses
- Analyses of electric, hybrid and conventional powertrains (HEV/EV/ICE)
- Dynamic backlash analysis in the powertrain
- Structural dynamic testing including experimental and numerical Modal Analysis and Operating Deflection Shape analysis (ODS)
- Hybrid methods combining numerical and experimental components
Anyone looking to leverage their market potential has to keep an eye on the competition as well as understand and respond to the expectations of their target group (customers).
Using a range of suitable methods, we help you to identify, validate and prioritize development potential:
- User studies (Customer Clinic) with methods such as HEAR! (HEAD Empirical Assessment Ride)
- Jury Testing
- Benchmarking, including sound quality metrics based on machine learning
Reliable mechanisms and instrumentation are vital to continuously ensure consistent product quality. We support your quality monitoring and documentation processes with the development of suitable, instrumental evaluation methods.
Our analysis capabilities and experience provide the basis for:
- Prediction of perceived sound quality through machine learning
- Vibroacoustic classification (such as for OK/NOK ratings)
- Creation of classifiers for end-of-line systems
Experimental and numerical methods as well as virtual models give vital insights into the interaction of individual components – already in an early development phase. This enables reliable prediction of the effect and potential impact of changes on real-life behavior.
Make the right design decisions at an early stage based on:
- A hybrid approach combining numerics and experiments
- Validation and comparison of numerical models and experimental data
- Optimization measures as part of parameter studies
- Numerical Transfer Path Analyses (TPA)
- Numerical Modal Analyses
- Numerical sound radiation calculations
- TPA dataset creation for the PreSense NVH simulator
- From test bench to interior sound: development of virtual prototypes based on test bench data
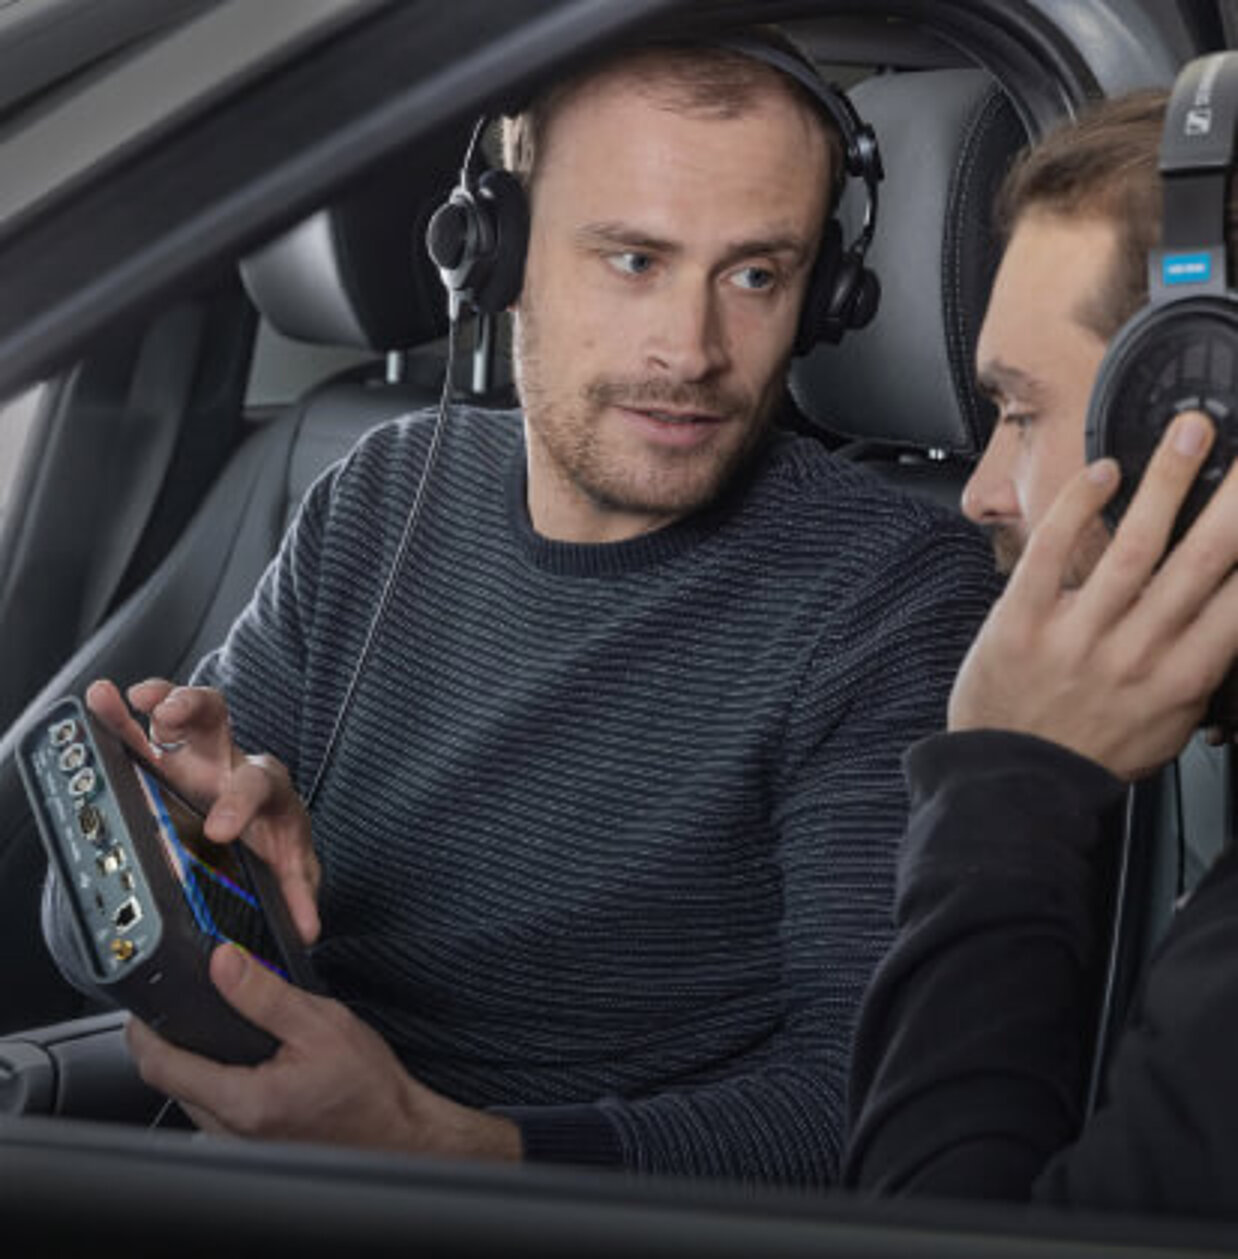
Many in-vehicle speech applications require extensive testing, optimization and certification. Whether hands-free communication, voice commands, In-Car Communication (ICC) or eCall certification: We optimize your implementation on a vehicle-specific basis – be it qualification of acoustic components and their placement, chipset tuning or optimization of the overall system.
Our services include:
- Testing in accordance with internationally binding standards of the ITU-T Series P.1100-P.1120 for hands-free communication in vehicles
- eCall certifications in accordance with ITU-T P.1140 or GOST 33468
- ICC optimization in accordance with ITU-T P.1150 or own procedures
- Qualification and optimization of voice recognition systems – on-board or off-board
- Tests and optimizations for a variety of manufacturer-specific standards (Amazon Alexa Auto, Apple CarPlay®, …)
- Own testing and optimization procedures – based on more than 20 years of testing and tuning experience
Whether international standards or individual specifications – our portfolio encompasses:
- Measurements in accordance with national/international standards such as AVAS, sound power, ETSI, ITU-T (including automation, documentation)
- Measurements in accordance with customer requirements/specifications (including automation, documentation)
- Execution of approval-relevant tests (e.g. for eCall)
- Development of individual measuring cycles and automated analyses
We measure and optimize all aspects of voice quality, simulate acoustic environment and network conditions and study user behavior for any communication application – from door intercom systems to ANC headphones, from single components to complex configurations.
Our tools:
- Instrumental determination of all basic parameters such as Loudness Ratings, transfer functions or distortions
- Perception-based test procedures such as 3QUEST, POLQA or EQUEST
- Test procedures for conversation quality and interaction between participants including realistic simulation of the acoustic environment
- Consideration of user behavior
- Auditory procedures in accordance with ITU-T – hearing tests, conversation tests, third-party listening tests, etc.
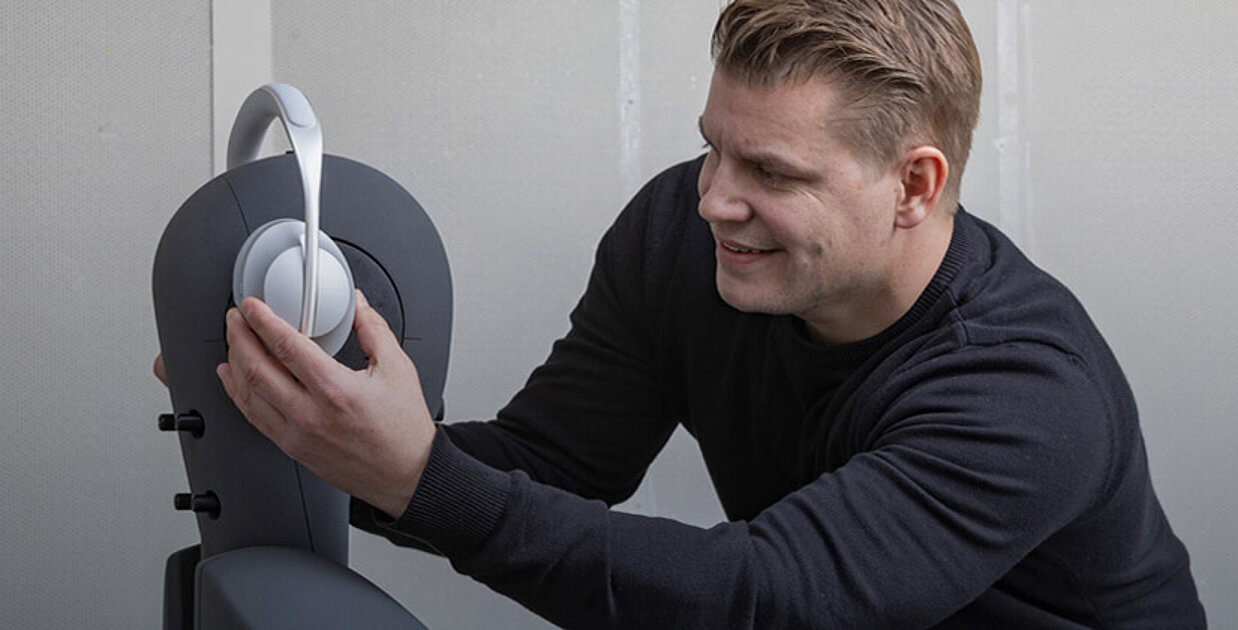
From individual components to complete audio systems: Our expertise and powerful test procedures allow us to work decisively and successfully when optimizing the audio quality – at all times:
- Measurements of electroacoustic parameters
- Measurement and optimization from single components to complete systems
- Instrumental measurements in accordance with international standards
- Unique, perception-motivated binaural measurement procedures
- Optimization beyond the requirements of standards
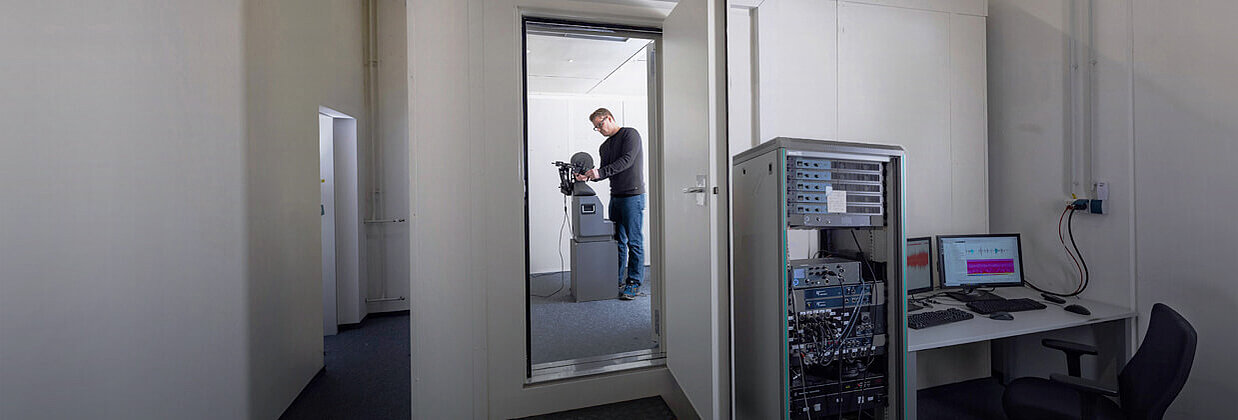
Testing and optimizing automatic speech recognition systems (ASR) with respect to different applications requires advanced measurement equipment and in-depth knowledge of acoustics. In our laboratories, we reproduce realistic acoustic conditions, we simulate user behavior and we use speech material tailored to your application.
Our portfolio includes the following services:
- Tests in accordance with given specifications (Apple, Amazon, Google, Microsoft, …)
- Consideration of speech and talker dependencies
- Integration of realistic background noise scenarios, reverberation and talker movement
- System testing and fine-tuning
- Benchmarking of competitor technologies
- Recording of speech materials including Lombard effect
Depending on the application, a range of measurement methods is needed for determining speech intelligibility and listening effort. We conduct measurements and implement optimization measures with the help of standardized and specially customized procedures always taking into account your customers’ acoustic environment and usage conditions.
Our portfolio includes:
- Use of modern, standardized procedures (STI/STIPA/STITEL, SII, ABLE, etc.)
- Realistic simulation of the acoustic environment
- Optimization of speech intelligibility and listening effort
- Balance between speech intelligibility/listening effort and voice quality
- Optimization of devices and systems
HEAD acoustics Inc. Engineering Services USA is an Authorized Test Lab for Alexa. You can work directly with us and utilize our lab to test and submit your product for certification. During the test, we will use test automation and a series of checklists provided by Amazon to ensure that your product meets acoustics, music, functional, and user experience (UX) requirements. We will also generate certification test results in the form of Alexa Qualification Tool (AQT) reports and manual checklists, for submission to Amazon.
As an ATL, we are going to help you bring your product to market with the speed, attention to detail, and care you would expect from yourself. We have an advantage of not only having a fully certified test lab, but also have consultants on staff with extensive experience of introducing any device with a speech and/or audio interface to the market. This knowledge allows us to troubleshoot and resolve any issues and continue certifying products in one efficient, streamlined process. We look forward to working with you and your cutting-edge products to advance the importance of understanding voice and sound quality.


In case you have not found your personal application in the list above, please do not hesitate to contact us.
You can also use the search function on this website and browse our applications section where we give an exemplary overview over applications and industries.
DO YOU HAVE ANY QUESTIONS?
Our Engineering team is ready to support you.
Call us or send an email.